Cloudy’s Chalkboard: Creating Dashboards
 Salesforce reports are a powerful tool for understanding your data, but when you have many reports, levels of complexity, and large amounts of data, it can be a lot to take in. Charts and Dashboards are the best way to create snapshot views of your data.
Good dashboards give executives the answers to the questions they care about most, give managers a handy tool to drive meetings, and give users an organized view of the things they need to prioritize. If you have never created a dashboard, here is a step by step tutorial to get you started.
Step 1: A dashboard is simply a visual representation of a collection of reports, so the first step is to create or identify the folder where you will store these reports. If Cloudy is creating a Sales Dashboard, he will create a new report folder and call it “Sales Dashboard Reports.” Since report privacy is set at the folder level, now is the time to think about who gets to see this data and make the appropriate settings on the folder. To create a new report folder, go to the Reports tab, click the folder icon at the top right of the folder menu, and select “New Report Folder.”
Step 2: Create Summary or Matrix reports showing what you want to represent with your chart components (Tabular reports cannot be used for dashboards). The Format settings menu is found in the Preview pane of the Report Builder; if you are relatively new to report building, start with a Summary report! Save your reports in the folder you created in Step 1.
Step 3: Create or identify the folder where you will store your dashboard. As with reports, privacy is determined at the folder level, so consider those security questions now. To create a new dashboard folder, go to the Reports tab, click the folder icon at the top of the left hand folder menu, and select “New Dashboard Folder.”
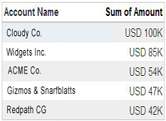 |
| A table can be configured to link directly to the listed records. |
 |
| Use a pie chart to show proportions against the total. |
Step 4: Create your Dashboard by going to the Reports tab and clicking the “New Dashboard” button. Using the drag-and-drop interface, add the chart types you want to use from the “Components” tab, and then find the matching reports from the “Data Sources” tab and drag them onto the correct components. You can use the same report for more than one chart if you want to represent the data in more than one way.
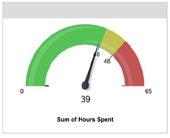 |
| A gauge shows progress toward a goal or a limit. |
 |
| A grouped line chart show data trends over time |
Step 5: Customize your chart components. You can add a title, subtitle, and footer simply by clicking in those spaces. Click the wrench in the upper right corner of each component to view further formatting options. (For a tutorial on one advanced formatting option, see Cloudy’s Chalkboard – Grouped Bar Charts)
When you are ready to view your completed dashboard, Click “Save As” and save the dashboard to the correct folder, then click “Close.” On the Dashboard viewing page, a “Refresh” button appears at the top of the page. Your dashboard will not refresh automatically; you must either click the button or schedule refreshes to occur regularly by clicking the down arrow next to “Refresh” and selecting “Schedule Refresh.” On this page, you will also see the option to have a dashboard emailed to you or any other user on a recurring schedule. This is a great way to keep managers or teams up to date.
If you have other questions about using dashboards, please leave a comment below, or Contact Us!
With the rapid evolution of technology, Salesforce solutions are ever-changing and improving features. Contact our team for up-to-date information.