Cloudy’s Bright Ideas: Forecasting
Salesforce donation records can give you quick insight into your organization’s donation forecast and pipeline. This information is incredibly powerful and easy to access, yet many organizations use Salesforce for years without seeing this important data. Learn how to use Salesforce pipeline and forecasting reports to drive your mission!
First, here are the Salesforce features you must know:
Donation fields:
- Amount: This is your ESTIMATED total donation amount. The Amount is not locked in until the donation closes – you should feel free to adjust it as you work through the cultivation and solicitation process!
- Close Date: The Close Date is an ESTIMATE of when you think the donation will close. Again, feel free to change it as you zero in on a realistic close date.
- Stage: Have you been fully leveraging ALL donation Stages? Many fledgling salesforce orgs only enter donations using the “Posted” stage, when the donation check is in hand. And while a surprise donation sometimes just walks in the door (if you are lucky!), in the case of your big donations, repeat donors, and grants, there are usually many steps you take to cultivate the donation before the check arrives. The Stage field is the place to track the cultivation process for a prospective donation. Default Stage values for nonprofit organizations are “Prospecting, Pledged, Posted, & Withdrawn”. (Note: you can add your own additional / custom stages to reflect your unique donor engagement strategy!)
- Probability: This is the percentage of estimated confidence in closing the opportunity. It has a default percent based on the Stage:
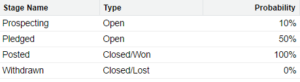 But you can override the default to set a different value than is implied by the stage. Perhaps you are in a very early stage but have a high degree of confidence that the donation will close! Or conversely, you may have made it all the way to final solicitation steps, but are still feeling like the chance of a close is slim. Either way, set the Probability to reflect this, and you will add intelligence to the Forecast.
 - Expected Revenue: This calculated field simply multiplies the Amount by the Probability. Ie. If a $10,000 donation is in the Prospecting Stage, with the default 10% Probability, then the Expected Revenue at this point is $1,000. This dollar amount is particularly valuable for your aggregate pipeline and forecast reports.
Reporting:
The above listed donation fields are all available in reports. Additionally, Salesforce provides some reporting-only fields that are helpful. Report-only fields you should be aware of are:
- Close Month
- Fiscal Period (ie. Quarter)
- Fiscal Year
These fields are very helpful for creating meaningful report groupings.
Results:
When you are leveraging the Stage picklist to track your donation cultivation process, and updating your Amounts & Close Dates as described above, you are ready to see your pipeline and forecast using simple Salesforce Reports and Dashboards. You won’t know how you lived without it!
Here are some example charts to fuel your imagination:
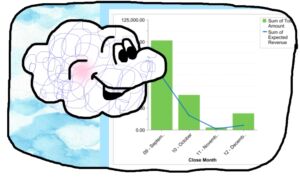
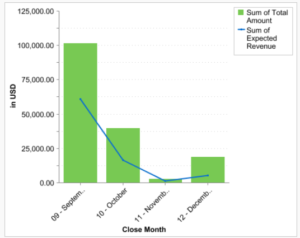 Pipeline this year: Columns show Total Amount & Line shows Expected Amount, based on probability.
Cloudy notices a large discrepancy between Total and Expected Amounts, even for this month (September), so he might want to ask the development team what’s going on with those donations; perhaps they need to update some Stage fields and Close Dates to reflect their latest knowledge on those prospects.
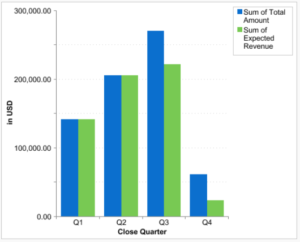 Pipeline this year, view 2: Here Cloudy sees Total Amount and Expected amount side by side. Assuming we are now in Q3: for past quarters, the columns are equal, which is what we would expect, and demonstrates good data quality (it means all past Donations have been marked Won, Lost, or had their close date moved to a future estimated date).
Cloudy is pleased to see steady growth through the first 3 quarters, but the Q4 forecast is looking weak!
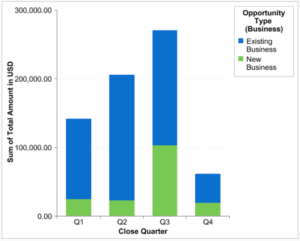 Pipeline this year, New vs Existing Donors: The Donor Type grouping on this forecast shows Cloudy that the strong growth in Q3 was largely driven by New Donors, while Existing Donors held steady.
Cloudy will commend the development team to keep up the great momentum with new donors, while pressing the accelerator a bit more on Existing Donors.
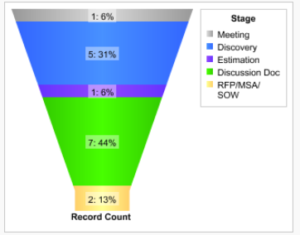
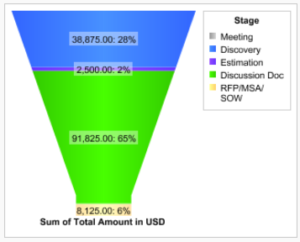
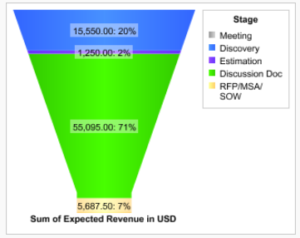 These three pipeline reports show the exact same opportunities, for the same time frame, but grouped by different values: Number of Donations, Total Amount, and Expected Revenue. Each one reveals different things about the pipeline, and the contrasts can be enlightening.
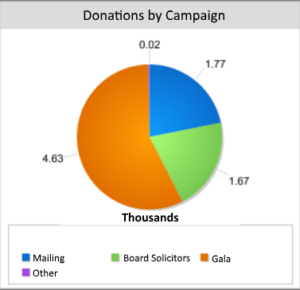 This pie chart shows donations by campaign source. You may already have a chart like this to show your campaign results for past donations, but you may also want to see the forecast for planned campaigns, which can be done based on your future donation pipeline.
These charts are just a sampling of what you can do with Salesforce reports and dashboards to track your donation pipeline and forecast. Other common forecast reports for nonprofits include:
- Household Giving vs Organization Giving
- Activity Tracking for Board Solicitors or Development Teams
- Future Grants planning and deadline tracking
- Donor Levels and Engagement Plans
- …This is one of Cloudy’s favorite subjects, and he could go on and on!
If you would like help getting started on your Donation Pipeline, or creating a Forecasting Dashboard, Contact Us!
For additional reading on this topic:
Everything you need to know to supercharge your fundraising strategy: HERE
A short & sweet blog post on moves management strategy using Salesforce: HERE
The Non Profit Success Pack’s BRAND NEW TOOLS for your Donor Engagement Plan:
With the rapid evolution of technology, Salesforce solutions are ever-changing and improving features. Contact our team for up-to-date information.